Updated: 8 May 2026
Methodology note: Figures cover General Government (not just the central state budget), in ESA 2010 / COFOG terms. Sources: 2025 Draft Budgetary Plan (Greek Ministry of Finance), Eurostat Government Finance Statistics (Q4 2025), European Commission Autumn 2025 Forecast, IMF Article IV Greece 2025, OECD Pensions at a Glance 2025. Spending sub-categories are estimates scaled from ELSTAT’s most recent COFOG breakdown. Aggregate revenue, total spending and the headline categories are firm. Rounded to €1B.
Where each euro of Greek tax ends up in 2025
You pay VAT at the supermarket, social-security contributions every month to EFKA, ENFIA in September. Where does it go?
In 2025, Greek General Government collected about €120B (around 49% of GDP) and spent about €117B. The primary surplus was around 4% of GDP and the headline surplus was ~€3B (around 1.1% of GDP). Greece was one of five EU member states running a surplus.
In the chart below, revenue sources are on the left, major COFOG spending categories on the right, and General Government in the middle as the transit hub.
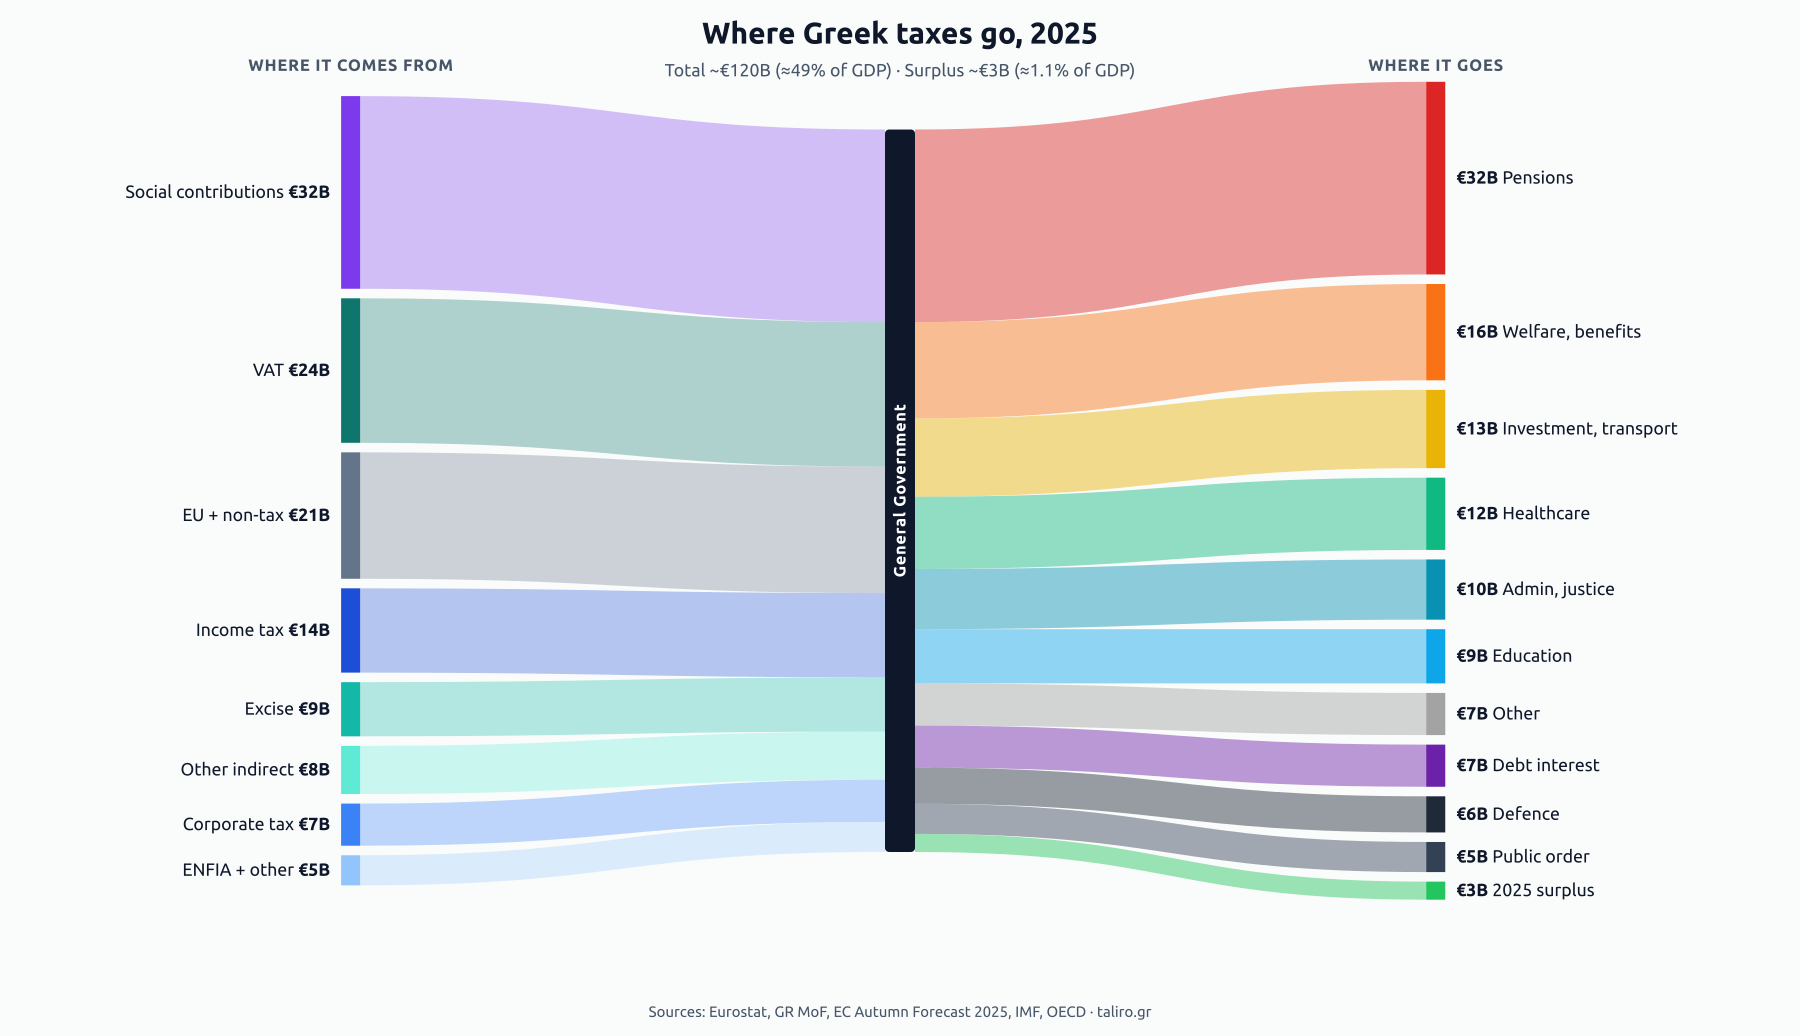
Where the ~€120B comes from
| Source | Amount | Note |
|---|---|---|
| Social-security contributions | €32B | EFKA (employee and employer, pensions, healthcare, unemployment) |
| VAT | €24B | 24% standard rate, above EU average |
| EU / RRF and non-tax | €21B | Recovery fund, structural funds, fines, SOE dividends |
| Personal income tax | €14B | Wages, pensions, freelancers |
| Excise duties | €9B | Fuel, tobacco, alcohol, electricity |
| Other indirect taxes | €8B | Vehicle taxes, stamp duty, gambling, etc. |
| Corporate income tax | €7B | 22% headline rate |
| ENFIA and other direct | €5B | Property tax and remaining direct taxes |
Two points:
- Social contributions raise more than VAT or income tax do on their own.
- EU and RRF transfers are the third-largest revenue line. Not a tax, a transfer. Strip them out and the balance gets tighter.
Where the ~€117B goes
| Category | Amount | What’s in it |
|---|---|---|
| Pensions | €32B | Main, supplementary, lump-sums |
| Other social protection | €16B | Unemployment, family, disability, minimum income |
| Economic affairs | €13B | Public investment, transport, energy, RRF projects |
| Healthcare | €12B | ESY, EOPYY, hospitals, pharmaceuticals |
| General public services | €10B | Justice, ministries, tax authority, diplomacy |
| Education | €9B | Schools, universities, teacher salaries |
| Other | €7B | Environment, housing, recreation, culture |
| Debt interest | €7B | Servicing ~146%-of-GDP debt |
| Defence | €6B | Procurement, salaries, operations |
| Public order | €5B | Police, fire service, coast guard |
| 2025 surplus | €3B | Goes to debt repayment and cash buffer |
The largest line is €32B for pensions. That is more than education, healthcare and defence combined.
10 international comparisons
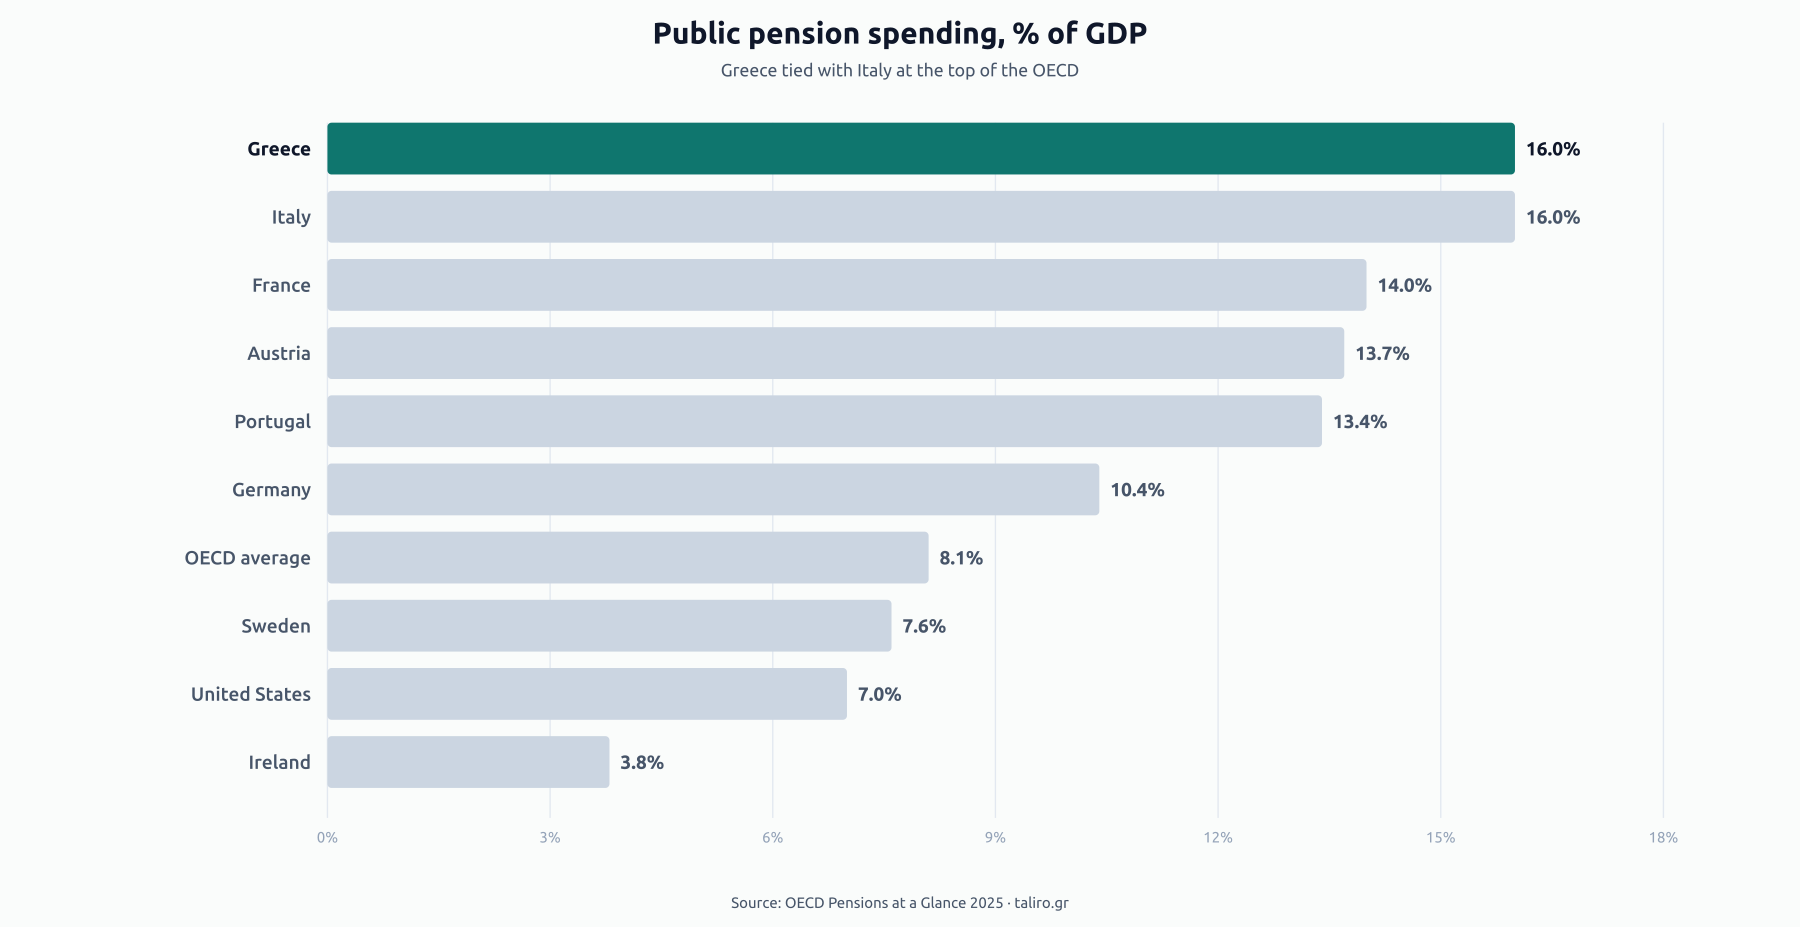
1. Pensions: 16% of GDP
Greek public pension spending is around 16% of GDP. It is the highest in the OECD, tied with Italy (Pensions at a Glance 2025). Ireland spends 3.8%, Malta 5.6%.
2. Pensions to schools: 3.5 to 1
€32B on pensions, €9B on education. Sweden’s ratio is closer to 1.2 to 1.
3. Education: 4th-lowest in the EU
At 3.9% of GDP, Greece sits just above Romania (2.9%) and Croatia (3.1%). Sweden spends 6.9%. Per-student spending is around $6,400 per year, against an OECD average above $11,000.
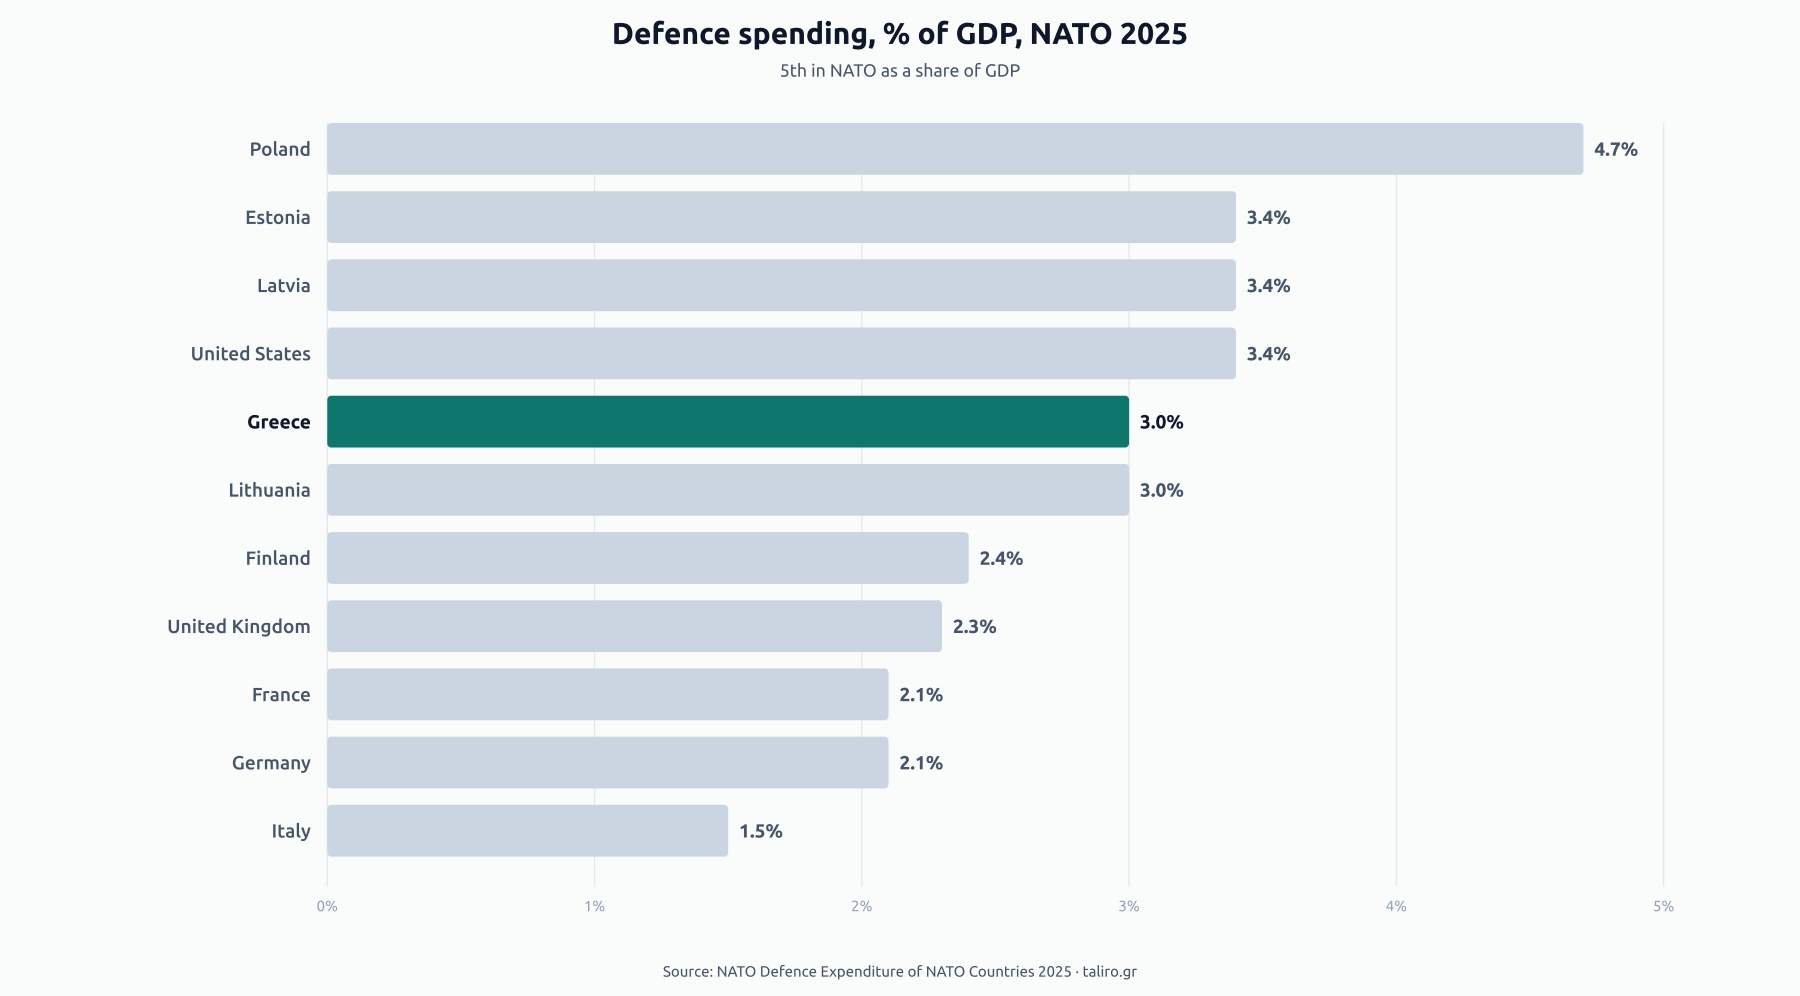
4. Defence: 5th in NATO
At 2.4 to 3% of GDP, Greece spends a bigger share of GDP than France, Germany or the UK. In NATO, only the US, Poland, Latvia and Estonia rank higher.
5. Defence to healthcare: about 1 to 2
€6B defence, €12B health. Most EU countries run 1 to 3 or 1 to 4. Germany around 1 to 4. Ireland around 1 to 8.
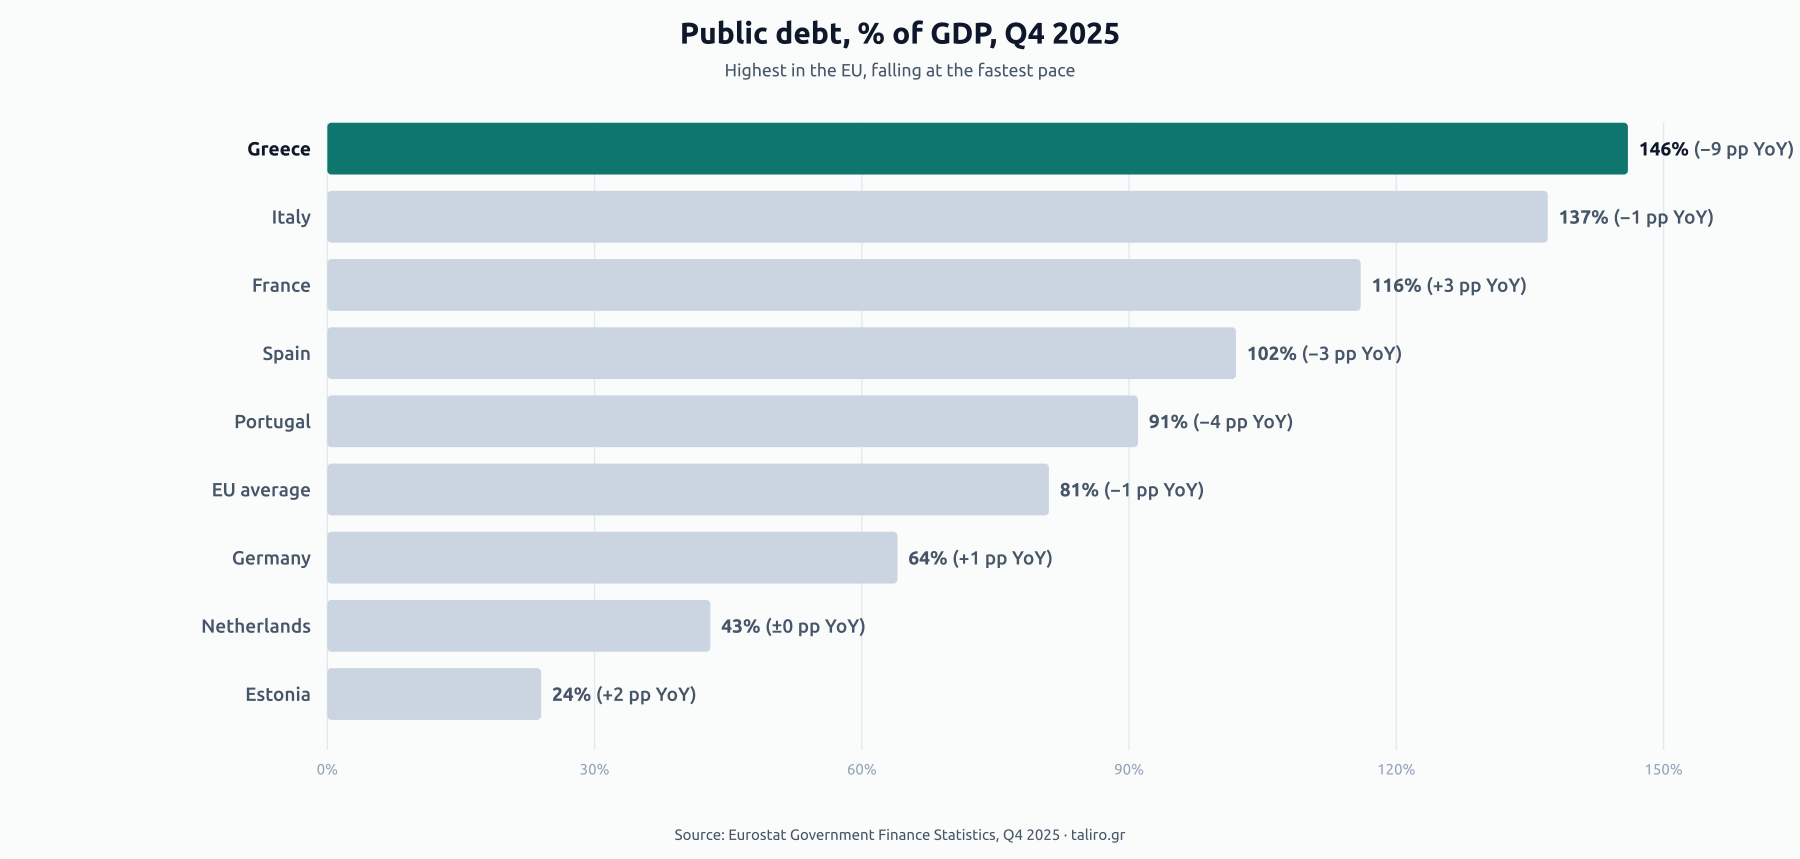
6. Highest debt-to-GDP in the EU
Greece ended Q4 2025 at 146% of GDP. Italy is at 137%, France 116%, Germany 64%. The ratio fell about 9 percentage points year on year, the fastest reduction in the EU.
7. Interest is relatively cheap despite the debt
Interest payments (€7B, around 3% of GDP) are lower than Italy’s (around 4% of GDP), even though Greek debt is higher. Reason: bailout-era loans are locked in at very low rates with about a 20-year average maturity (Italy’s is around 7).
8. Indirect taxes: 27.5% of revenue
VAT and excise together raise €33B. The 24% VAT rate is above the EU average (21.8%). Switzerland’s standard VAT rate is 8.1% for comparison.
9. Family tax wedge: 38%
Combining contributions and income tax, the average tax wedge on a Greek family with children is around 38%, against an OECD average of 26%. For every €100 the worker costs the employer, about €62 reach the household.
10. Primary surplus around 4% of GDP
The US runs a primary deficit of about 3% of GDP. France about 3%. Italy near zero. Greece runs a primary surplus of about 4% of GDP. That is the main reason debt is falling fast.
Summary
- Pensions: 16% of GDP. 3.5 to 1 ratio against education.
- Defence: 5th in NATO as a share of GDP.
- Primary surplus: about 4% of GDP. Debt falling at the fastest rate in the EU.
- VAT and excise: about 28% of revenue.
- Corporate income tax: €7B. Social contributions: €32B.
What this means for you
About 27% of the budget goes to pensions. In practice, social-security contributions will not drop soon. If you are a worker or freelancer:
- The Gross to Net calculator breaks your salary down into EFKA and income tax.
- Considering going freelance or opening an IKE? The Employee vs B2B calculator shows how the total tax burden compares.
- For retirement planning, the EFKA Pension calculator estimates what you will get back.
Related posts:
- Greek income tax changes 2026. The 2 percentage-point bracket cuts now in law.
- Average and median salaries 2024-2025. How your pay stacks up.
Sources
- 2025 Draft Budgetary Plan, Greek Ministry of Finance
- Eurostat Government Finance Statistics, Q4 2025
- European Commission Autumn Forecast 2025, Greece
- IMF Article IV Greece 2025
- OECD Pensions at a Glance 2025
- NATO Defence Expenditure of NATO Countries 2025
Last updated: 24 May 2026. This information is for general guidance and is not tax advice.